Nursing informatics is the nursing specialty that focuses on using the tools and processes inherent in automation to achieve the goals of nursing. Computers are excellent devices for managing the smallest of details, thereby supporting a safer, more efficient, and more effective quality healthcare system. At the same time, they are able to manage enormous databases of information and knowledge. But in the end – at the point of patient outcome - what is important is the ability to apply these tools in helping patients, consumers, families and communities.
One must always remember that the capabilities of computers (which are always changing) do not define the scope of practice for nursing informatics; rather, it is how nurses use these tools that define their practice. In turn, if we do not understand how nurses at all levels of knowledge and experience use computers to support their practice, we cannot design automated systems that truly support the goals of nursing.
The Data, Information, Knowledge and Wisdom Model (DIKW Model) provides a theoretical framework for defining the scope of practice for nursing informatics. In Part 1 of this two-part column, the driving forces for the creation of the DIKW Model were explained. Here in Part 2, the development of the model, and the evolution of the figures used to illustrate the model, are described. The figure used in this column, illustrating the model is still a 'work in process.' This column concludes by discussing limitations of the current figure and encouraging future leaders to develop a figure that more fully and effectively articulates the rich and complex relationships within the model, and in turn the scope of practice for nursing informatics.
Regarding the history of the DIKW Model and Related Figures, the initial attempt to articulate the concepts within the DIKW Model was a brief article defining the concepts of Data-Information-Knowledge-Wisdom (Nelson & Joos, 1989). This publication did not include a model, but rather a table briefly explaining the concepts (See Table). The third column of the Table also identified the relationship between the concepts of data, information, knowledge, and wisdom and the various levels of computer systems.
Table. Terms, Meaning and Related Computer System
|
TERM |
MEANING |
RELATED COMPUTER SYSTEM |
|
Data |
Raw facts |
Information System |
|
Information |
Raw fact processed to produce meaning |
|
|
Knowledge |
Group of interrelated pieces of information |
Decision-Support System |
|
Wisdom |
Ability to apply knowledge to human problems |
Expert System |
Over the next decade subsequent publications, for example, (Joos, et al., 1996; Nelson, 2001) expanded on the four concepts, but did not create a figure showing the relationships between the concepts.
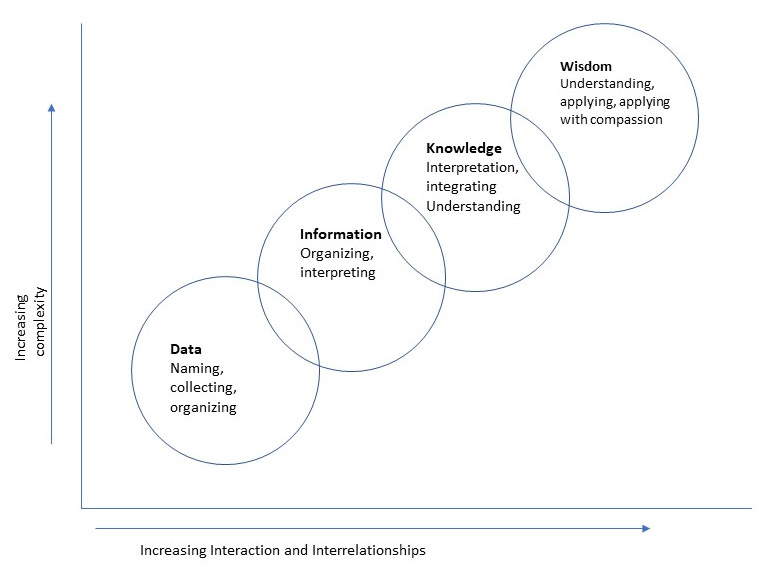
The first figure (See Figure 1) illustrating the model focused on the overlapping relationships between the concepts of data, information, knowledge and wisdom. The overlapping nature of the relationships between these concepts was depicted in the overlapping circles and in the words used to define the concepts. For example, the word organizing is included with both data and with information. This first version of the model (Nelson, 2002) was published by Mosby, in a health informatics textbook (Englebardt & Nelson, 2002).
Figure 1. Nelson Data to Wisdom Continuum.


Used with the permission of Ramona Nelson, President Ramona Nelson Consulting at ramonanelson@verizon.net. Copyright 2002. All rights reserved.
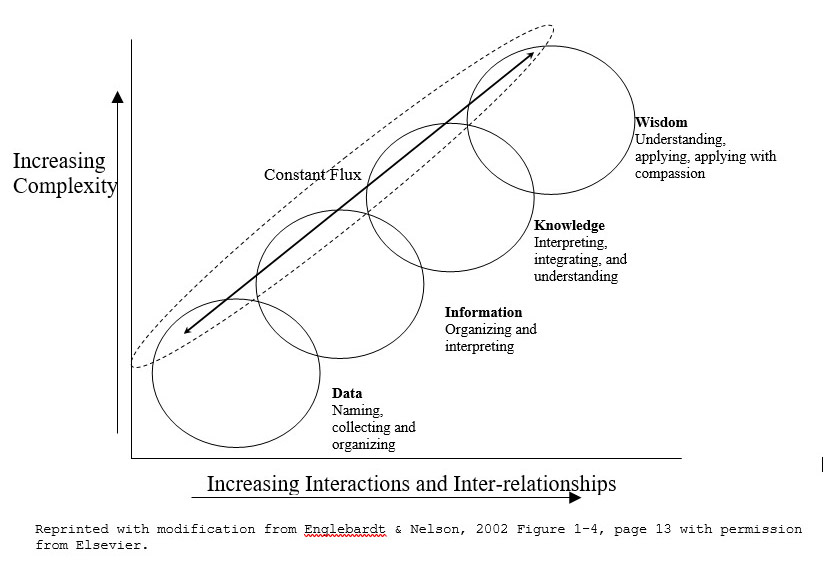
At the time this textbook was written, Mosby was owned by Harcourt Brace & Company. In 2001, Reed Elsevier acquired Harcourt Brace & Company and Mosby then joined Elsevier. During this period, I was a member of the American Nurses Association (ANA) task force that had been charged with revising the 2002 ANA Scope and Standards of Practice for Nursing Informatics. In that role, I requested and received permission from Elsevier/Mosby for the ANA to print a modified version of Figure 1 that was subsequently titled Figure 2. Figure 2, as printed in this column, is a copy of that figure as it was printed in the 2002 ANA Scope and Standards for Nursing Informatics (ANA, 2002), including the permission that was used in that publication..


This second figure was an improvement on the first figure in that the interactions between and across the concepts was more effectively articulated. The double-headed arrow moving through each of the concepts signified that the flow of interactions moved throughout the continuum from data to wisdom. The oval with a dashed line labeled constant flux illustrated that this is an open system with constant interaction between the internal and external environment. In other words, context is important when using the model to understand specific phenomenon.
Shortly after the ANA publication, the copyright to the book was returned from Elsevier to the authors and I now own the copyright to these two figures as well as Figure 3, which was created in 2013. Since the copyright was returned, anyone who has made a request has been given permission to use any or all of the figures in publications, presentations and research free of charge. The only limitation is that permission to modify the figure is never granted and there is always a request to acknowledge the copyright. Many people have excellent ideas related to the model and how it may be used, but I believe permitting the publication of several different figures reflecting different interpretations of the DIKW model, all of which are identified as being the model, will create confusion – not clarity.
There have been publications that have included an inaccurate illustration of the model. The best source for ensuring you are viewing an accurate illustration of the model is the various editions of the ANA Standards of Practice for Nursing Informatics and my own publications.
While Figure 2 was a significant improvement, it still did not fully project the richness and complexity of the interactions within the model. It also did not appear to generate an appreciation for the importance of context as presented by the interaction within and between the internal and external environment. Figure 3 was developed and first published in a discussion of the theoretical foundations of health informatics presented in Chapter 2 of the textbook, Health Informatics: An Interprofessional Approach (Nelson & Staggers, 2014).
Figure 3. Revised Nelson Data to Wisdom Continuum.


Each revision of the model was created to more effectively illustrate the interacting relationships across the continuum and the inter- and intra-environmental factors that influence movement across and within the data to wisdom continuum. However, the current Figure depicting the Model continues to be limited by the reality of illustrating a four-dimensional phenomenon with a two-dimensional medium. Print, be it on screen or paper, is two dimensions. However, the Nelson DIKW continuum should first be conceptualized as an open living system with all the characteristics of an open living system. With such a system, time, the fourth dimension, is also part of the picture. So now, the question remains what would an automated three-dimensional model (maybe a hologram) look like, if it was fully functioning and changing over time?
Ramona Nelson, PhD, BC-RN, ANEF, FAAN
Email: ramonanelson@verizon.net
